Results Analysis - Tree | Dendrogram
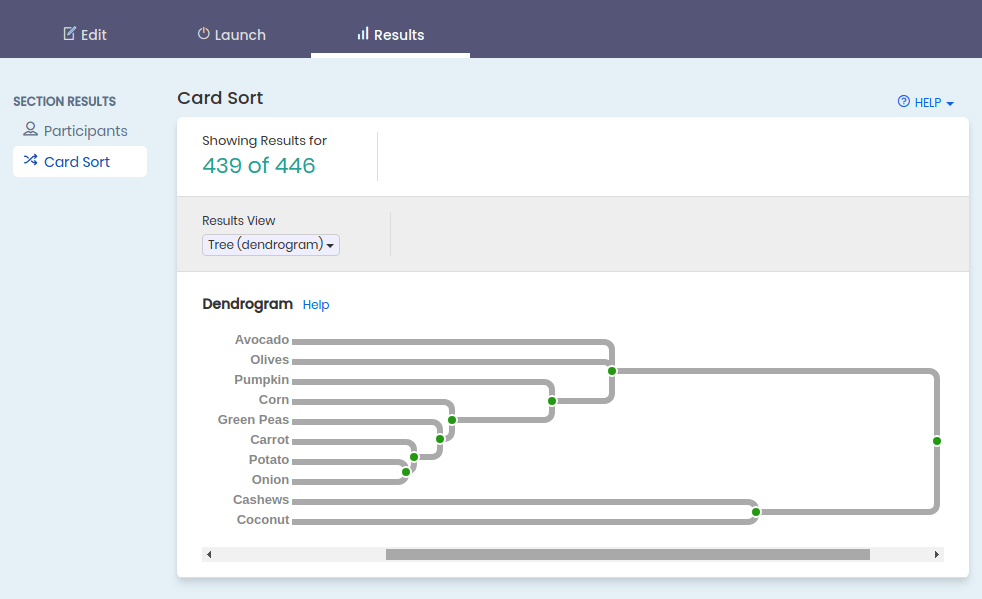
A Tree view (aka Dendrogram) is a representation of the frequency of cards being grouped together.
The tree should be read left to right - as strong to weak clusters. Hovering over any cluster circle will show you the strength of that cluster as a percentage. 100% meaning all participants grouped those cards together. 50% meaning half of the participants placed those cards in the same group.
Our dendrogram uses the average link cluster algorithm finds a set of cards( two or more ) with the highest similarity score/percentage. It then forms a cluster and replaces the items in the set with the cluster. The process is then repeated. When a cluster is analyzed against another card or cluster, the average of the similarity scores between all members is used.