Results Analysis - Group x Card View
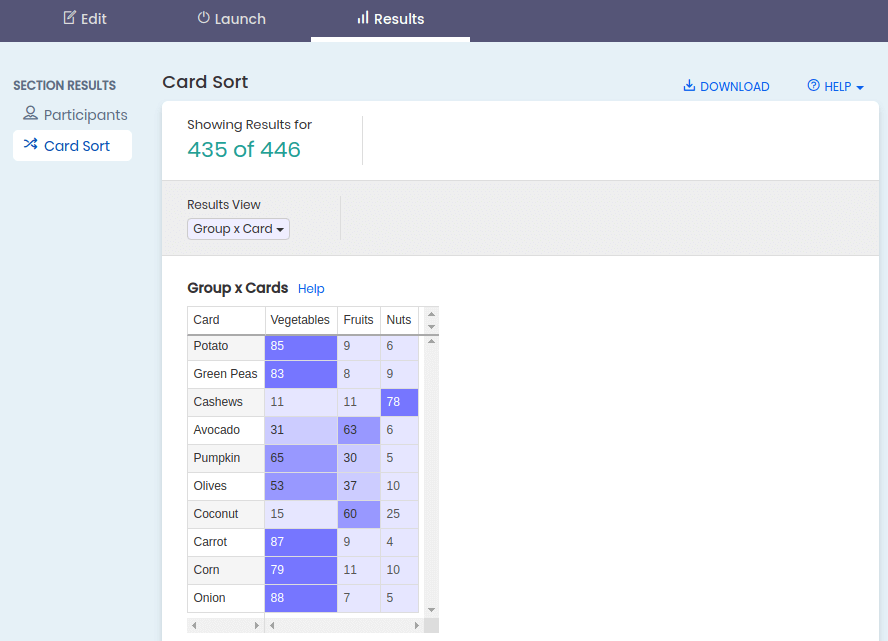
The Groups x Cards table displays the percentage of time a card is placed in a group.
The first column shows the list of cards, and the remaining columns show the group name in the header. A value of 100 means that all participants placed the card in the group. Cells are colored darker blue each additional 20% of agreement. To simplify results display decimal values are not shown therefore each card row will not total 100 in all situations. For example if a card was placed in a group 1/3 of the time we represent the value as 33, when in fact it is 33.333.